
Epistasis Illustrated
to make the concept and formulas make sense

Genetic interactions in complex systems that do not necessarily show up in genome-wide association methods are an important explanation for missing heritability and the limited predictive power of polygenic scores. At least that is the hypothesis that Fred Nijhout and I have been testing by quantifying the epistasis that emerges from genetic interactions in a mathematical model of one-carbon metabolism. Epistasis calculations need to be grounded in an understanding of the phenomenon. I was surprised not to be able to find simple clear explanations on the web, so I created illustrations that I hope will make epistasis easier to understand and calculate.
When William Bateson coined the term “epistasis” in 1909, he imagined one gene standing (“epi”) on top of another (“stasis”) and thereby blocking its effects. If he had instead simply called such phenomena “non-additive genetic interactions” vast confusion would have been prevented, but we are stuck with the term. Epistasis now refers more broadly to any instance in which the effect of one mutation on a phenotype is changed by the presence of another mutation. I use the term “gene” instead of allele because our model is haploid, and I call variants “mutations” for simplicity, even though the variations can have other origins.
Quantifying epistasis requires four values:
the phenotype (PT) when all genes are at wild type (WT),
the change in the PT value when only gene A is added, or the PT value when all other genes are at WT (PTA)
the change in the PT value when only gene B is added, or the PT value when all other genes are at WT (PTB), and
the PT when both A and B are present (PTA&B).
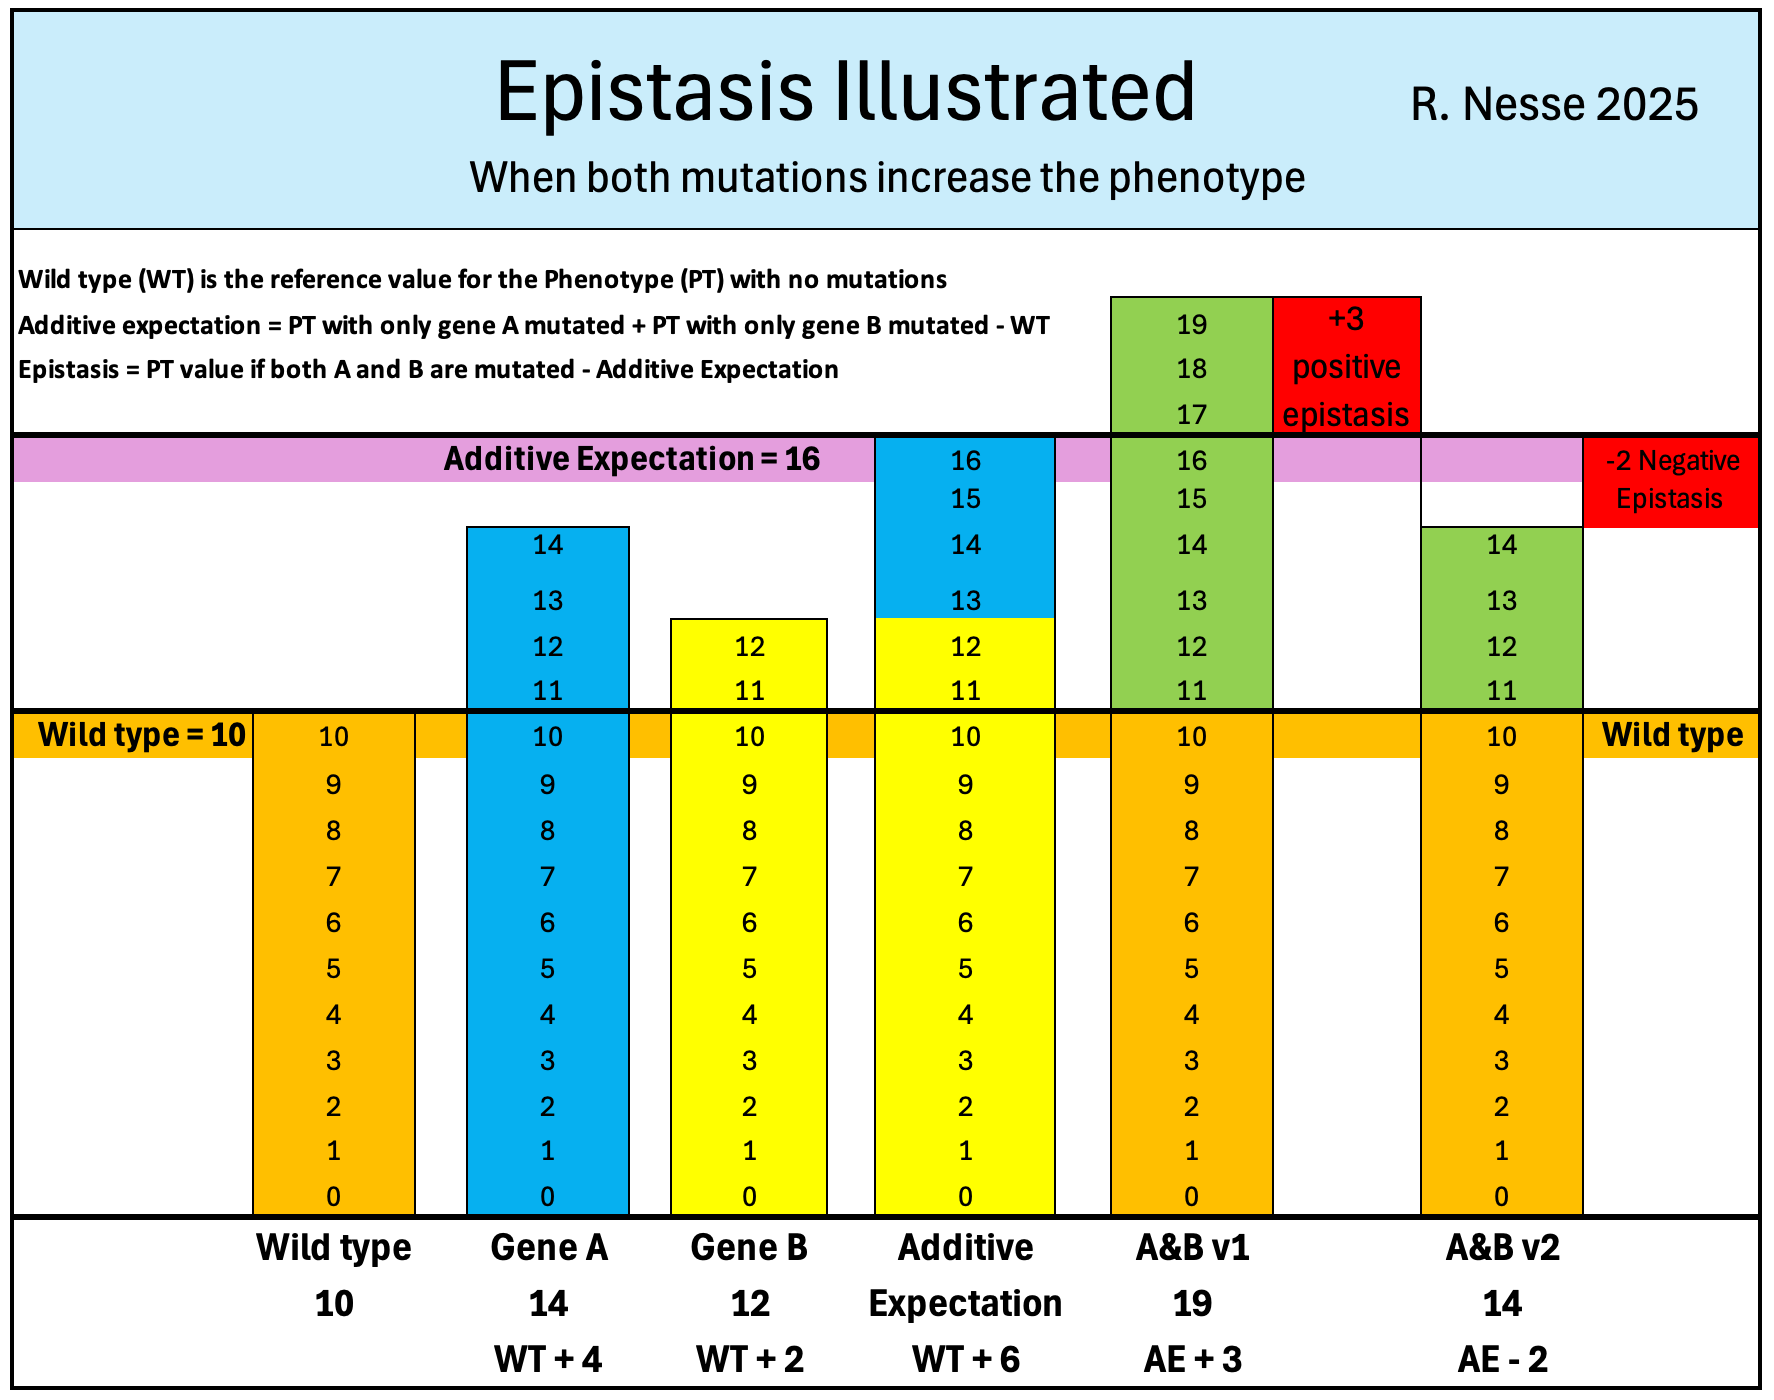
The first step in calculating epistasis is to find the Additive Expectation (AE).
AE is the PT value predicted if there are no interaction effects so that the sum of the independent effects of gene A and gene B plus the WT gives the value of PTA&B.
AE is calculated by adding (PTA-WT) and gene B (PTB-WT) to WT.
AE = (PTA - WT) + (PTB - WT) + WT, simplifies to
AE = PTA + PTB - WT.
In the above figure, WT is 10, PTA is 4 above WT, PTB is 2 above WT, so the AE is 10+4+2=16.
Epistasis is the difference between PTA&B and the AE.
Epistasis = PTA&B – AE which is the same as
Epistasis = PTA&B – (PTA + PTB + WT) which is the same as
Epistasis = PTA&B – PTA - PTB – WT.
In the above figure, the gene combination A&Bv1 gives a phenotype of 19, which is 3 more than the WT of 16, so the epistasis is +3. For gene combination A&Bv2 the phenotype is 14, 2 less than the WT, so the epistasis is negative at -2.
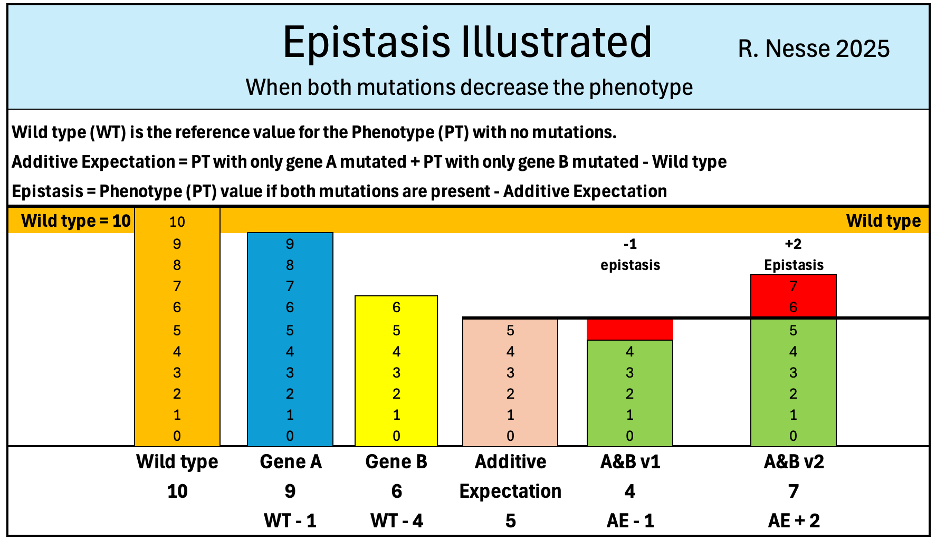
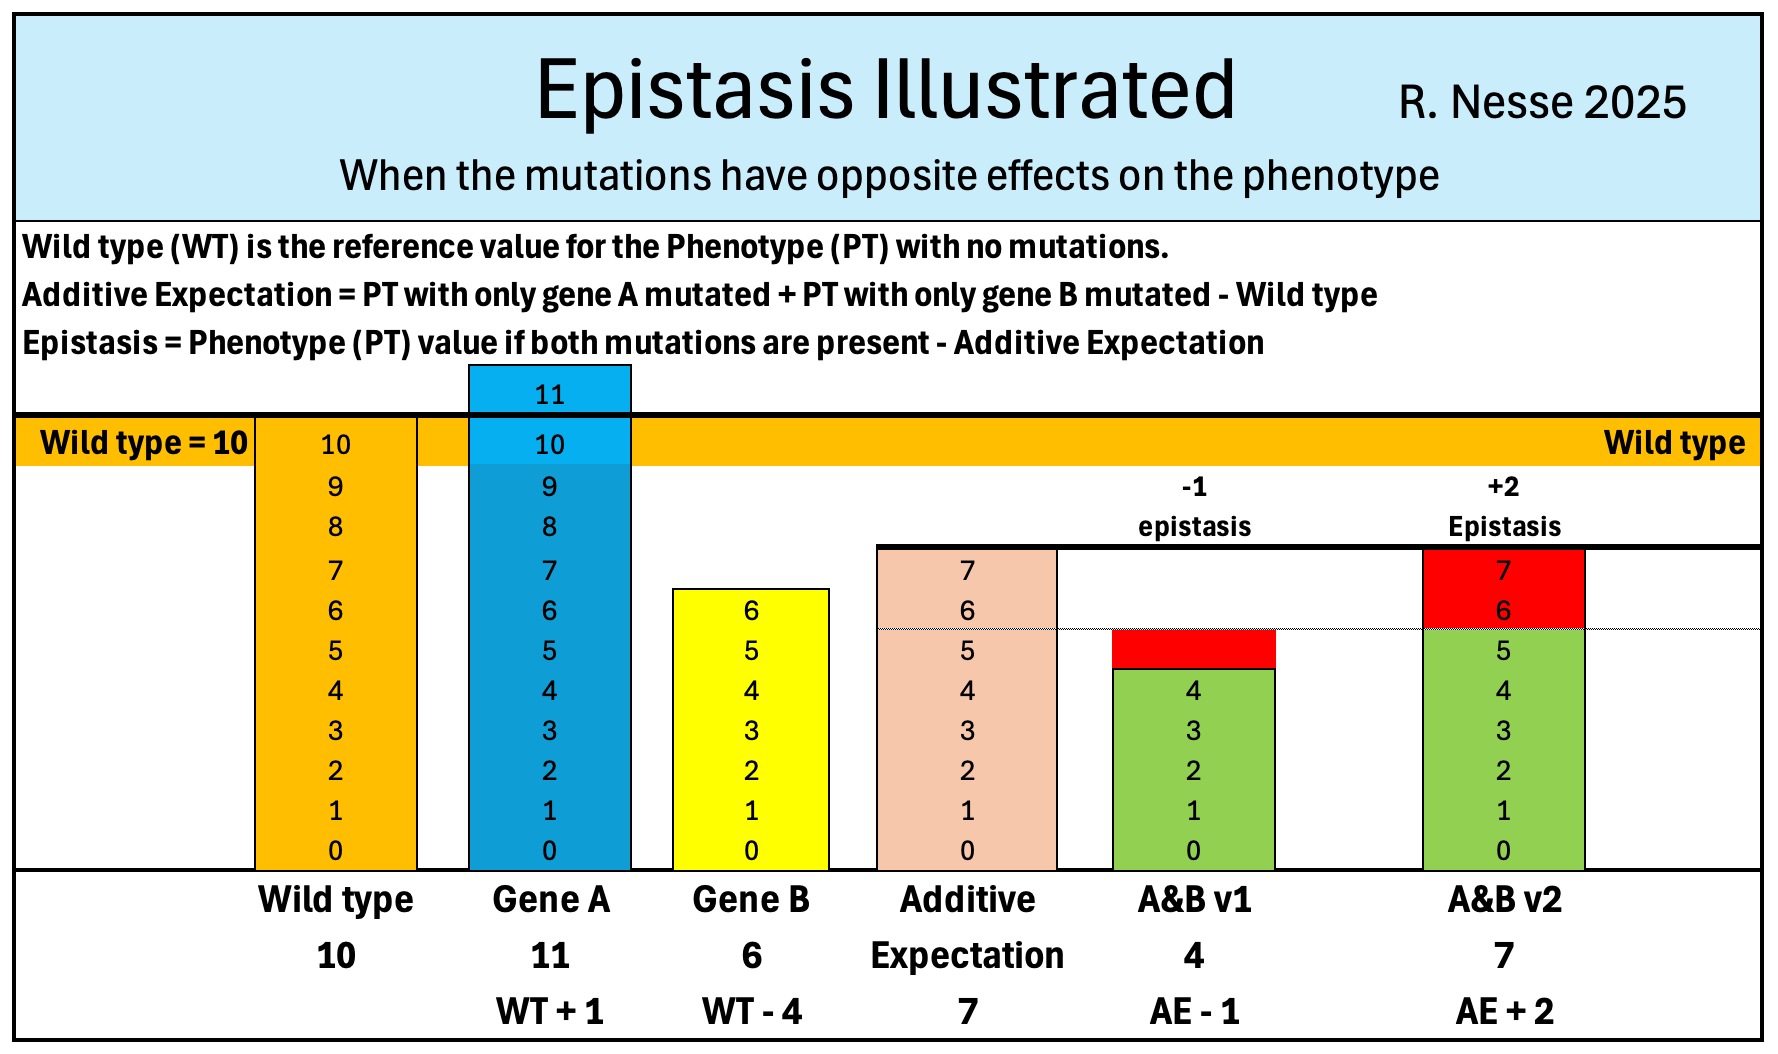
The additional figures below illustrate AE and epistasis when both mutations reduce the PT, and when one mutation increases the PT and the other reduces it.
I hope these illustrations and formulas help to clarify what epistasis is and how to calculate it, and would be glad to hear from those who find them useful and those who have suggestions.
A PDF version is available at this link and more is at RandolphNesse.com